When it comes to blogs and websites, understanding what your readers and customers want can be the key that unlocks your site’s success, however, figuring this out can be much easier said than done.
Although Google Analytics provides important metrics to help you learn more about your website and how people are using it, the large majority of website owners often find this very useful tool to be quite daunting.
Well, we’re here to tell you that, although Google Analytics may seem over-whelming when you first log in, it is not as complicated as it first appears. In-fact, once you know what the important metrics are and where to find them, it couldn’t be easier.
To help you gain better understanding of Google Analytics , we’ve picked out the top 5 Google Analytics metrics to monitor, what these metrics tell you about your website and, most importantly, where to access them.
1: Sessions
In Google Analytics, a “session” refers to a group of interactions that take place on your website within a given a time frame (usually 30 minutes.) In those 30 minutes, a user can have a number of interactions with your website including multiple page views, social interactions or transactions. All of these interactions count as one session once they take place within the 30 minute time period.
A session ends when a user either becomes inactive for 30 minutes or at midnight. For example, if a user is on your website, leaves and then returns after 29 minutes, this will count as the same session. However, if this person leaves and returns after 30 minutes, this will count as a new session. Also, if a person logs onto your site at 11:55PM and stays until 12:10AM, they will have logged two sessions, the first ending at 11:59PM and the second beginning at 12:00AM.
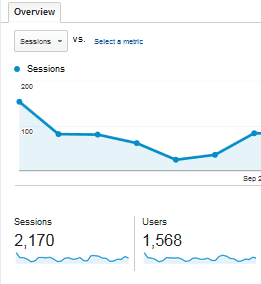
Knowing the number of sessions your website receives is vital as it lets you know just how many times your website has been visited. If these numbers are low, you know you need to work on making your site more visible, if they are high, you know that what you are doing is working.
You can access your sessions information by clicking “Audience” and then selecting “Overview” from the drop down menu.
2: Users
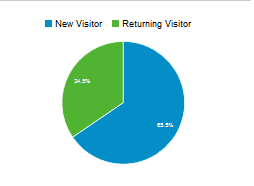
Google Analytics classes a user as somebody who has had “at least one session within the selected date range” making this a great metric for figuring out how popular your website or blog is.
It is important to note that this figure includes both new and returning visitors meaning you will need to click into a new section of analytics, under “Behaviour”, to separate these two figures.
Knowing the exact numbers of new and returning visitors is important for anyone who may have just launched a new marketing campaign as a large number of “new visitors” indicates that your campaign is working. However, if you have not launched a new campaign, your new and returning visitors figures should be balanced as this indicates that people are enjoying what they find on your website and are coming back for more.
Users can also be broken down into their specific locations if you click into “Audience” and then into “Demographics”. It’s always handy to know where your readers and customers are based as this allows you to tailor your website’s content to specifically appeal to people from the particular country or city that has the highest numbers.
3: Bounce Rate
In simple terms, bounce rate is when a user only visits one page of your website before leaving and is calculated by tracking the amount of users who leave your site from the page they entered on.
The bounce rate can indicate a number of different things. Firstly, a high bounce rate can mean that users are not finding the information they are looking when they access your site. Secondly, it can also mean that users are finding exactly what they are looking for and have no need to search the rest of the website. Thirdly, it can mean that there is nothing on the page to call the user to explore your site more.
As most users will enter your site through your landing page, it is always a good idea to check the bounce rate of this particular page to ensure it is doing its job effectively. This can be done by clicking on “Behaviour”, “Site Content” and then on “Landing Pages”. A high bounce rate on a landing page indicates that some work needs to be done in order to stop visitors from clicking that exit button.
4: Engagement
How your users engage with your site is extremely valuable information. One of the best ways to measure this engagement is by finding out just how long visitors are spending on your site and what content is the most popular.
To find out how long the average duration of each visit is, simply access the “Overview” section of the “Audience” tab. If you have a blog, you want this figure to be a longer period of time as it means that people are enjoying what they are reading and are taking the time to read other posts. For other websites, such as online travel agents or banks, shorter periods of time are better as this indicates the website is well laid out and that customers can complete their purchases and transactions quickly.
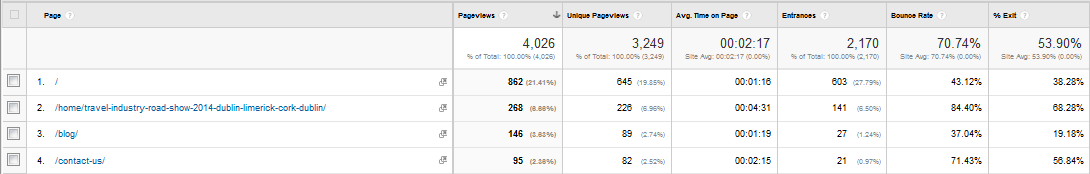
Similarly, finding out what pages are the most visited on your site can give you an indication of what content is working, and what isn’t. Simply clicking into “Site Content” under the “Behaviour” tab and then clicking “All Pages”, will provide you with an overview where you will able to see the pages with the highest views.
From this tab you will also be able to see a number other of important metrics including:
- Unique pageviews – the number of visits during which the page was viewed at least once
- Average time on a page – average time visitors spent on this page
- The exit rates – how many people left the site immediately after the visiting this page
- The entrance rates – how many people landed on this page
5: Traffic and Referrals
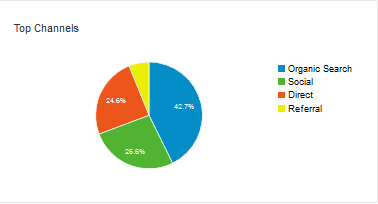
Knowing where the visitors on your site are coming from is important as it will let you know which platforms are most effectively helping you to you reach your audience.
This information can be obtained by clicking into “Overview” on the “Acquisition” drop down menu. From here, you will see a breakdown of all the different ways users accessed your site. These are broken down into:
- Organic – the user found your website using certain key words
- Direct – the user typed your site’s URL into the browser
- Social – the user clicked a link to your website from a social media platform
- Referral – the user clicked a link on another website and was brought to your site
- Paid search – the user came to your website via a Google AdWords ad or another paid, online campaign.
Clicking into each individual traffic source also brings up more useful information. For example, clicking into “Organic” will show you the most popular key words used to search for your website, while clicking into “Social” will show you which social media networks brought the most visitors to your website.
Remember
There are countless different types of metrics that can be accessed on Google Analytics and every website will value different metrics above others. It is important for you to take the time to decide what you want your website or blog to achieve and select your key metrics from there. Some metrics are easier to get and some are more complex however, the above should give you a good head start on the road to becoming a Google Analytics whizz.
Want to learn more about using Google Analytics? Contact a member of the TravelMedia.ie team.
You can follow Travelmedia.ie on Facebook, Twitter, Google+ and LinkedIn